Non Destruction Inspection ada beberapa macam diantaranya:
1. Radiographic Testing
2. Ultrasonic Testing3. Acoustic Emission Testing
4. Magnetic Particle Testing
5. Liquid Penetrant Testing
6. Eddy Current Testing
7. Strain Measurement
A. Scientific Principles No single NDT method will work for all flaw detection or measurement applications. Each of the methods has advantages and disadvantages when compared to other methods. The table below summarizes the scientific principles, common uses and the advantages and disadvantages for some of the most often used NDT methods.
Penetrant
Testing | Magnetic Particle Testing | Ultrasonic
Testing |
 |  |  |
| Scientific Principles |
|
|
| Penetrant solution is applied to the surface of a precleaned component. The liquid is pulled into surface-breaking defects by capillary action. Excess penetrant material is carefully cleaned from the surface. A developer is applied to pull the trapped penetrant back to the surface where it is spread out and forms an indication. The indication is much easier to see than the actual defect. | A magnetic field is established in a component made from ferromagnetic material. The magnetic lines of force travel through the material, and exit and reenter the material at the poles. Defects such as crack or voids cannot support as much flux, and force some of the flux outside of the part. Magnetic particles distributed over the component will be attracted to areas of flux leakage and produce a visible indication. | High frequency sound waves are sent into a material by use of a transducer. The sound waves travel through the material and are received by the same transducer or a second transducer. The amount of energy transmitted or received and the time the energy is received are analyzed to determine the presence of flaws. Changes in material thickness, and changes in material properties can also be measured. |
| Eddy Current
Testing | Radiographic
Testing |
 |  |
|
|
| Alternating electrical current is passed through a coil producing a magnetic field. When the coil is placed near a conductive material, the changing magnetic field induces current flow in the material. These currents travel in closed loops and are called eddy currents. Eddy currents produce their own magnetic field that can be measured and used to find flaws and characterize conductivity, permeability, and dimensional features. | X-rays are used to produce images of objects using film or other detector that is sensitive to radiation. The test object is placed between the radiation source and detector. The thickness and the density of the material that X-rays must penetrate affects the amount of radiation reaching the detector. This variation in radiation produces an image on the detector that often shows internal features of the test object. |
B. Main Uses
Penetrant Testing
Used to locate cracks, porosity, and other defects that break the surface of a material and have enough volume to trap and hold the penetrant material. Liquid penetrant testing is used to inspect large areas very efficiently and will work on most nonporous materials. | Magnetic Particle Testing
Used to inspect ferromagnetic materials (those that can be magnetized) for defects that result in a transition in the magnetic permeability of a material. Magnetic particle inspection can detect surface and near surface defects. | Ultrasonic Testing
Used to locate surface and subsurface defects in many materials including metals, plastics, and wood. Ultrasonic inspection is also used to measure the thickness of materials and otherwise characterize properties of material based on sound velocity and attenuation measurements. |
Eddy Current Testing
Used to detect surface and near-surface flaws in conductive materials, such as the metals. Eddy current inspection is also used to sort materials based on electrical conductivity and magnetic permeability, and measures the thickness of thin sheets of metal and nonconductive coatings such as paint. | Radiographic Testing
Used to inspect almost any material for surface and subsurface defects. X-rays can also be used to locates and measures internal features, confirm the location of hidden parts in an assembly, and to measure thickness of materials. |
C. Main AdvantagesPenetrant Testing Large surface areas or large volumes of parts/materials can be inspected rapidly and at low cost. Parts with complex geometry are routinely inspected. Indications are produced directly on surface of the part providing a visual image of the discontinuity. Equipment investment is minimal.
| Magnetic Particle Testing Large surface areas of complex parts can be inspected rapidly. Can detect surface and subsurface flaws. Surface preparation is less critical than it is in penetrant inspection. Magnetic particle indications are produced directly on the surface of the part and form an image of the discontinuity. Equipment costs are relatively low. | Ultrasonic Testing Depth of penetration for flaw detection or measurement is superior to other methods. Only single sided access is required. Provides distance information. Minimum part preparation is required. Method can be used for much more than just flaw detection. |
| Eddy Current Testing Detects surface and near surface defects. Test probe does not need to contact the part. Method can be used for more than flaw detection. Minimum part preparation is required.
| Radiographic Testing Can be used to inspect virtually all materials. Detects surface and subsurface defects. Ability to inspect complex shapes and multi-layered structures without disassembly. Minimum part preparation is required. |
C. Disdvantages
Penetrant Testing Detects only surface breaking defects. Surface preparation is critical as contaminants can mask defects. Requires a relatively smooth and nonporous surface. Post cleaning is necessary to remove chemicals. Requires multiple operations under controlled conditions. Chemical handling precautions are necessary (toxicity, fire, waste).
| Magnetic Particle Testing Only ferromagnetic materials can be inspected. Proper alignment of magnetic field and defect is critical. Large currents are needed for very large parts. Requires relatively smooth surface. Paint or other nonmagnetic coverings adversely affect sensitivity. Demagnetization and post cleaning is usually necessary.
| Ultrasonic Testing Surface must be accessible to probe and couplant. Skill and training required is more extensive than other technique. Surface finish and roughness can interfere with inspection. Thin parts may be difficult to inspect. Linear defects oriented parallel to the sound beam can go undetected. Reference standards are often needed.
|
| Eddy Current Testing Only conductive materials can be inspected. Ferromagnetic materials require special treatment to address magnetic permeability. Depth of penetration is limited. Flaws that lie parallel to the inspection probe coil winding direction can go undetected. Skill and training required is more extensive than other techniques. Surface finish and roughness may interfere. Reference standards are needed for setup. | Radiographic Testing Extensive operator training and skill required. Access to both sides of the structure is usually required. Orientation of the radiation beam to non-volumetric defects is critical. Field inspection of thick section can be time consuming. Relatively expensive equipment investment is required. Possible radiation hazard for personnel. |
1. Radiographic Testing
(RT) Radiographic Testing, or industrial radiography, is a nondestructive testing (NDT) method of inspecting materials for hidden flaws by using the ability of short wavelength electromagnetic radiationphotons) to penetrate various materials. (high energy)

Either an X-ray machine or a radioactive source (Ir-192, Co-60, or in rare cases Cs-137) can be used as a source of photons. Neutron radiographic testing (NR) is a variant of radiographic testing which uses neutrons instead of photons to penetrate materials. This can see very different things from X-rays, because neutrons can pass with ease through lead and steel but are stopped by plastics, water and oils.
Since the amount of radiation emerging from the opposite side of the material can be detected and measured, variations in this amount (or intensity) of radiation are used to determine thickness or composition of material. Penetrating radiations are those restricted to that part of the electromagnetic spectrum of wavelength less than about 10 nanometres.
Inspection of welds
The beam of radiation must be directed to the middle of the section under examination and must be normal to the material surface at that point, except in special techniques where known defects are best revealed by a different alignment of the beam. The length of weld under examination for each exposure shall be such that the thickness of the material at the diagnostic extremities, measured in the direction of the incident beam, does not exceed the actual thickness at that point by more than 6%. The specimen to be inspected is placed between the source of radiation and the detecting device, usually the film in a light tight holder or cassette, and the radiation is allowed to penetrate the part for the required length of time to be adequately recorded.
The result is a two-dimensional projection of the part onto the film, producing a latent image of varying densities according to the amount of radiation reaching each area. It is known as a radiograph, as distinct from a photograph produced by light. Because film is cumulative in its response (the exposure increasing as it absorbs more radiation), relatively weak radiation can be detected by prolonging the exposure until the film can record an image that will be visible after development. The radiograph is examined as a negative, without printing as a positive as in photography. This is because, in printing, some of the detail is always lost and no useful purpose is served.
Before commencing a radiographic examination, it is always advisable to examine the component with one’s own eyes, to eliminate any possible external defects. If the surface of a weld is too irregular, it may be desirable to grind it to obtain a smooth finish, but this is likely to be limited to those cases in which the surface irregularities (which will be visible on the radiograph) may make detecting internal defects difficult.
After this visual examination, the operator will have a clear idea of the possibilities of access to the two faces of the weld, which is important both for the setting up of the equipment and for the choice of the most appropriate technique.
Defects such as delaminations and planar cracks are difficult to detect using radiography, which is why penetrants are often used to enhance the contrast in the detection of such defects. Penetrants used include silver nitrate, zinc iodide, chloroform and diiodomethane. Choice of the penetrant is determined by the ease with which it can penetrate the cracks and also with which it can be removed. Diiodomethane has the advantages of high opacity, ease of penetration, and ease of removal because it evaporates relatively quickly. However, it can cause skin burns.
2. Ultrasonic Testing
Assembling an Ultrasonic Test System
Ultrasonic test systems can take several forms, but the most common for automated test is immersion testing, as shown in Figure 1. To have good acoustical impedance matching between the couplant and the UUT and free range over the entire surface of the UUT, many test systems use an immersion tank filled with water.
[+] Enlarge Image
Figure 1. Example of an Ultrasonic Test System
These test systems use one or more ultrasonic transducers, which are moved over the surface of the unit under test (UUT). As the transducer is moved over the surface, it is pulsed and receives echoes from various surfaces. This process is repeated many times a second - sometimes more than 50,000 times per second (>50 kHz). There are several pieces of the test system that must work together to get expected results. The following list includes the steps, and the accompanying hardware and software pieces, required to get one pulse and the subsequent echoes:
-
Application software - The user interacts with the application software to set up the test and presentation parameters.
-
Motion control - The ultrasonic transducer is moved over the appropriate area over the UUT.
-
Communication - The pulser/receiver operation parameters, such as pulse energy, pulse damping, and bandpass filtering, are set. The communication path is typically RS232 or USB.
-
Pulser/receiver - This device generates the high-voltage pulse that is required by the ultrasonic transducer.
-
Ultrasonic transducer - The transducer is pulsed, sending out an ultrasonic wave. The subsequent echoes generate a voltage in the transducer, which is sent back to the pulser/receiver.
-
Pulser/receiver - The analog signal from the ultrasonic transducer is amplified and filtered before it is sent back to the digitizer within the PC.
-
Digitizer - The waveform sent from the pulser/receiver is converted from voltage to bits using an analog-to-digital converter (ADC).
-
Application software - Data from the digitizer is processed, analyzed, and presented according to the user-defined parameters.
If there are multiple transducers that are coupled with one digitizer/pulser/receiver combination, switches much be used.
There are several hardware and software components that must interact effectively for even the simplest ultrasonic test system to work properly. When assembling your custom ultrasonic test system, there are several factors to consider for each component of the system, including how well the components interact with one another. The Ultrasonic Transducer section describes each component of the test system in detail as well as the important features required for ultrasonic testing.
Ultrasonic Transducer
Ultrasonic transducers are built around piezoelectric ceramics that vibrate at ultrasonic frequencies when a voltage is applied, and generate voltages when vibrated. The piezoelectric ceramics can be packaged in a variety of housings, depending on how they are used. For instance, ultrasonic transducers used in field service are commonly contact sensors, and are contoured to the surface to be inspected. These transducers have special wear and handling requirements because of how they are used.
Ultrasonic transducers perform according to two main parameters: resolution and sensitivity. The resolution of a particular transducer is denoted by its ability to discern between two discontinuities that are on top of one another. A transducer with sufficient resolution will stop ringing, or vibrating, from the first discontinuity before receiving the echo from the second discontinuity. If the ceramic does not stop ringing before the second echo is received, the second echo is masked from the test system. Sensitivity of an ultrasonic transducer refers to the ability to detect small discontinuities. Reference blocks with standard sized defects are used to gauge the sensitivity of a particular transducer.
The frequency of the transducer is chosen based on the required sensitivity and depth of penetration. Remember that the higher the frequency, the better the sensitivity, but lower penetration depth.
Figure 2. Noncontact Ultrasonic Transducers (Courtesy of The Ultran Group)
Figure 3. Standard Contact Ultrasonic Transducers (Courtesy of Panametrics-NDT)

Figure 4. Standard Immersion Ultrasonic Transducers (Courtesy of Panametrics-NDT)
Pulser/Receiver (P/R)
These devices provide the high-voltage pulse required by the ultrasonic transducer as well as signal conditioning before the analog signal is passed to the digitizer. For use within an automated test system, the P/R should be computer programmable via a standard PC bus such as RS232 or USB. The devices are typically programmed one time at the beginning of the test to set the pulse voltage level, pulse repetition frequency, damping, band pass filtering settings, and several other parameters. After these parameters are set, these devices are passive and do not send any information back to the PC during operation.
The motion controller, digitizer, and P/R must operate as one tightly timed unit during the test to ensure accuracy of results and brevity of test time. The P/R can act as the master timebase of the system or can act as a slave to the digitizer or motion controller. In the applications where motion control is implemented, it is typically the slowest part of the system and, for that reason, acts as the master timebase.
Digitizer
This portion of the test system converts the echo waveforms returned by the ultrasonic transducer into digital information using an ADC. Consider the following factors when choosing the digitizer for your system:
- Sample rate
- Bandwidth
- Vertical resolution
- Triggering features
- Memory
- Bus type
For applications that require well-shaped waveforms in the time-domain, such as research, a sample rate 10 times higher than the resonant frequency of the transducers is required. In these applications, a transducer that has a resonant frequency of 5 MHz requires 50 MS/s to accurately represent the shape of the signal. However, for applications that require less amplitude and echo-timing accuracy, 4-5x the resonant frequency is acceptable.
Vertical resolution establishes the minimum voltage step size within a voltage range. 16-bits is equivalent to 65,536 (2^16) steps. When a 16-bit ADC is applied to a voltage range of 0-10 Volts, the minimum voltage step size is 0.153 mV (10 V / 65,536). However, when an 8-bit ADC is applied to the same range, the minimum voltage step size is 39 mV (10 V/256). In ultrasonics, the voltage amplitude is proportional to the amount of energy echoed by the discontinuity or flaw. The front face and back face of the UUT generally reflect the most energy, while flaws reflect much less. To see the energy reflected from small flaws, the signal from the transducer must be amplified or the digitizer must have high resolution. Amplifying the signal to detect a small flaw can cause the front surface and back surface reflection voltages to swing outside the voltage range of the digitizer. On the other hand, additional resolution permits the user to zoom in on small flaws and not distort main surface reflections at the same time. High resolution also relaxes the amplification levels required by the P/R component.
Figure 5. Example of an Ultrasonic Acquisition
The digitizer typically acts as a timing slave within an ultrasonic test system, while the motion controller or the P/R acts as the master. Flexibility of internal or external timing is essential for ultrasonic test applications. Programmable trigger delay is also a useful feature for ultrasonic testing. In immersion testing, the ultrasonic wave must travel through a significant distance of water before arriving at the UUT. If this distance is known, a trigger delay can be implemented to minimize the amount of unnecessary data that is recorded and stored.
Timing and triggering between multiple devices can be simplified when using a bus that is designed for integrated test systems. PXI uses the PCI bus for high-speed data transfer with the addition of timing and triggering lines. The timing and triggering lines within PXI negate the need for external cabling, which reduces error and clutter. This capability also reduces the overall test time because all I/O is hardware synchronized, which minimizes time wasted with software timing. Learn more about the architecture and advantages of PXI.
Because of the high frequencies associated with ultrasonic test, the amounts of collected data can be staggering. This data can be handled in many ways depending on the computer bus being used and the data collection rate. For instance, the PCI bus can realistically handle 80 MB/s (or 40 MS/s at 16-bit) of continuous data throughput to PC memory. If your application requires more than 40 MS/s sample rate, onboard device memory must be a consideration. In either case, the speed at which the data can be transferred back to permanent PC storage, such as a hard drive, after device onboard memory is full, must be a consideration. If data is transferred over a slow bus, such as USB 1.0 at 10 MB/s, the amount of time required to transfer data can easily double or triple the amount of time required to test one UUT. Find the bus that works best for your application.
There is a trade-off between resolution, speed, channel count, data throughput, and cost. However, as ADC technology, PC memory, and data transfer rates evolve, many of these trade-offs have become or will become insignificant with respect to cost.
Performance Comparison of NI Digitizers
| Family | Model | Bus | Max. on-board memory (samples) | # of channels | Max. sample rate per channel (S/s) | Input resolution (bits) | Bandwidth (Hz) |
| Digitizer | | PXI | 512 M | 2 | 200 M | 12 | 150 M |
| Digitizer | | PCI, PXI | 256 M | 2 | 100 M | 14 | 100 M |
| Digitizer | | PCI, PXI | 32 MB | 2 | 100 M | 8 | 100 M |
| S Series | | PCI, PXI | 64 M | 4 | 10 M | 12 | 7.2 M |
| S Series | | PXI | 32 M | 8 | 3 M | 14 | 1.3 M |
| M Series | | PCI, PXI | 4095 | 32 | 1.25 M | 16 | 1.7 M |
| M Series | | PCI, PXI | 2047 | 32 | 625 k | 18 | 725 k |
Motion Control
Most automated ultrasonic test systems use motion control to gather multiple points of data with one transducer. For instance, acquiring b- or c-scans requires movement of the ultrasonic sensor over the UUT surface to create a surface map. There are a few basic features that are required for ultrasonic test motion control such as servo and/or stepper control, multi-axis control, a position feedback interface, and so on. However, there are several features that can make ultrasonic test much faster and more efficient. Because the motion control system typically acts as the master trigger, triggering flexibility is the key to ensure interoperability and efficiency with your particular test needs. A combination of position, velocity, and acceleration triggering, which are commonly referred to as breakpoints, is required to ensure the test is accurate and repeatable. Also, the ability to share motion breakpoints with other I/O without external cabling, as available with PXI, guarantees all I/O are synchronized in a repeatable fashion.
Feature Comparison of NI Motion Controllers
| Feature | | | |
| Maximum number of axes | 4 | 2,4 | 2,4,6,8 |
| Servo control | - | ü | ü |
| Closed-loop stepper control | ü | ü | ü |
| Linear interpolation | ü | ü | ü |
| Configurable move complete criteria | ü | ü | ü |
| On-board programming functionality | - | ü | ü |
| Number of axes per 62.5 microsecond PID rate | 1 | 1 | 2 |
| Static PWM outputs | 2 | 2 | 2 |
| DIO lines | 32 | 32 | 64 |
| Digital-to-analog converter | - | 16 bit | 16 bit |
| Analog-to-digital converter | 12 bit | 12 bit | 16 bit |
| Maximum step output rate | 4 MHz | 4 MHz | 8 MHz |
| Encoder rate | 20 MHz | 20 MHz | 20 MHz |
Switching
For ultrasound applications that have one digitizer and pulser/receiver for multiple ultrasonic sensors, switching is required to route the signals properly. This topology is common in applications that use arrays of sensors to create images. Arrays of ultrasonic sensors are common in biomedical and nondestructive test applications because the sound energy can be steered in multiple directions without moving the sensor array. Multitransducer applications are also common when speed of test is an issue.
The three main consideration when choosing a switch for ultrasound applications are voltage rating, bandwidth, and switch topology. Common switch topologies include matrix and multiplexing. In large test systems, it is common to use a matrix topology that connects multiple instruments with multiple test points. In ultrasound applications, it is more common to use the multiplexing topology, which connects one digitizer/pulser/receiver combination to multiple sensors. NI offers multiplexing switches, which range extend from 4x1-wire up to 256x1-wire.
Ultrasound pulser/receivers can create very high voltages. If this is the case, your switching devices should have the clearances and creepages necessary to withstand these transient voltages. Your switching devices should also have the appropriate amount of bandwidth compared to the ultrasonic transducer and should be impedance matched to the rest of the system. If the switches do not have enough bandwidth, the signal generated by the pulser or the echo returning from the transducer will be attenuated. Proper impedance matching, typically 50 ohm, is required to minimize reflections and keep the signal clean.
NI offers a full line of switches that offer RF bandwidths and transient voltage protection necessary for ultrasound applications.
Application Software
Ultrasonic test application software combines many types of I/O, analysis algorithms, and presentation techniques to form one software interface. The application software can be separated into three basic parts: acquisition/control, analysis, and presentation. Acquisition/control refers to the interface between the application software and the hardware that you have assembled for your ultrasonic application. For the most flexibility as test parameters change, make certain that a wide variety of hardware is supported by the application software.
Some of the required analysis algorithms for ultrasonic test are peak detection, computation of distances based on material properties, wave rectification, statistics, fast Fourier transforms (FFTs), level crossing, and filtering. Some of these algorithms are simple while others are complex and computationally intensive. Computationally intensive algorithms included in the application software should be optimized, especially in ultrasonics applications where the presentation is graphically intensive. To ensure that the application software is not the limitation for your application, make certain that the analysis libraries will grow with your application needs.
There are several ways to look at ultrasonic test data ranging from TOF to surface scan. The most common scans are referred to as A-, B-, and C-scans. The TOF scan, or A-scan, is analogous to the display on an oscilloscope, which displays voltage amplitude versus depth. The depth is calculated by multiplying the speed of sound through the medium by the time of flight.
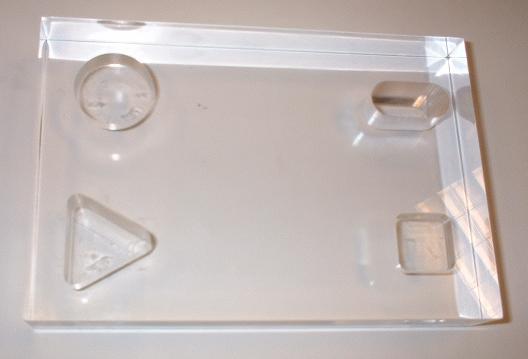
Figure 6. Unit Under Test (UUT) Used for this Example
The UUT used in the following examples is a rectangular block. Four features of various shapes have been machined into this block at various depths.
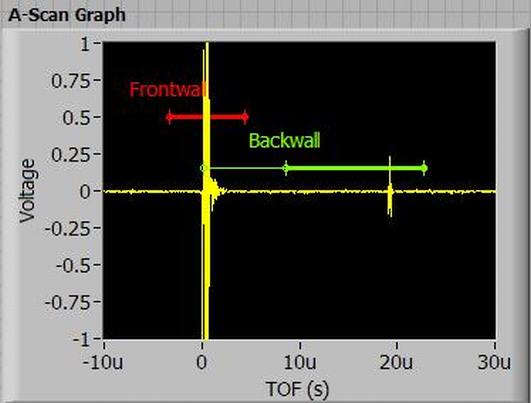
Figure 7. Example of an A-Scan
In the A-scan, shown in Figure 7, the first echo is from the front surface of the material and the second echo is from the rear surface of the material. Using the information above, it would be simple to calculate the thickness of the material. If there was a flaw within the material, you would see a small peak somewhere between the frontwall and backwall.
Imagine the voltage peaks in the A-scan moving back and forth over time. This movement is caused by the varying thickness of the UUT as the transducer is moved over the surface. In many applications, which map the surfaces/flaws of a material, motion control plays a key role in collecting data. Put all of those A-scan images together and the result is a B-scan. The B-scan below shows the echo peaks moving over time. B-scans display depth versus linear position along the UUT.
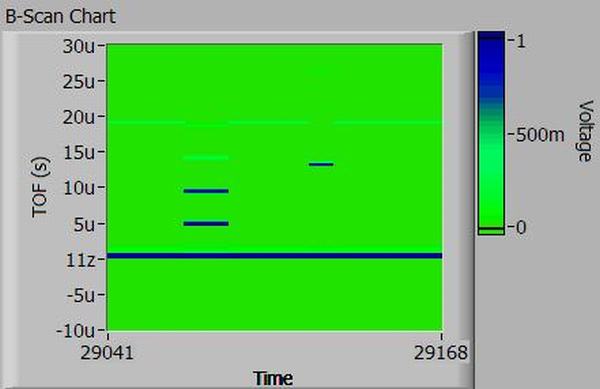
Figure 8. Example of a B-Scan
Looking at a C-scan shown in Figure 9, is analogous to looking through an opaque material in the direction of the ultrasonic wave. C-scans display x- and y-position, while the color represents depth.
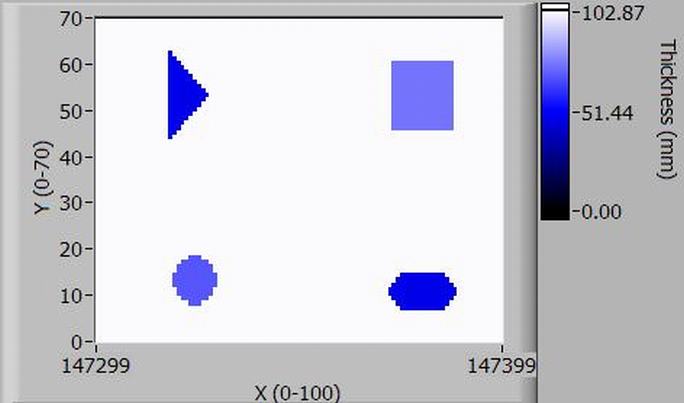
Figure 9. Example of a C-Scan
Graphical Representation of the UUT
One of the main trends in nondestructive test, and ultrasonic test in particular, is full automation of test. Automation not only includes automation of the data collection and presentation, but also includes automation of pass/fail for any particular UUT. Setting pass/fail templates for A-, B-, and C-scans increases statistical accuracy and eliminates much of the subjectivity that is commonly found when performing NDT. One such method that can be used on C-scans is blob analysis. With blob analysis, you can analyze objects in your image and classify objects according to size, location, and quantity. This type of analysis, and many more, is available in NI Vision Builder for Automated Inspection.
Because of the wide variety of requirements in ultrasonic test, it is difficult to find turn-key software that uses the hardware components, specialized algorithms, and unique displays that your application requires. The alternative to turn-key software is application development software, or programming. With custom application development, you can assemble all of the hardware, analysis, and presentation components that your application requires. Furthermore, graphical application development environments, such as NI LabVIEW, allow a novice programmer to create advanced ultrasonic test programs easily and quickly.
NI LabVIEW has connectivity to thousands of instruments, regardless of bus connectivity or instrument type. In addition, software packages such as NI Vision Builder for Automated Inspection, NI Motion Assistant, and the NI DAQ Assistant let you to interactively configure your ultrasonic test and subsequently generate LabVIEW code to use in your custom application.
LabVIEW has hundreds of analysis and mathematics functions, including FFT, peak detection, Hilbert Transforms, or anything your ultrasonic test application could require. Also, if you application involves more than just an ultrasonic test portion, LabVIEW and extend to other types of test and control. Regarding the presentation abilities of LabVIEW, all of the A-, B-, and C-scan figures above were all created in LabVIEW; however, they are referred to as graphs, intensity charts, and intensity graphs. LabVIEW is a general-purpose test and measurement tool that applies extremely well to ultrasonic test, whether it is acquisition/control, analysis, or presentation.


